

Last week we revealed which neighbourhoods in Bedford had seen a rise in the average house price, despite the coronavirus pandemic.
In Bedford, prices rose by 1.5 per cent in the year to September 2020. Across the East of England, prices rose by 2.2 per cent.
But what about the areas where prices fell?
The ONS also publishes house price figures by Middle Layer Super Output Areas (MSOAs) – small geographic areas containing an average of 7,200 people.
These are the eight neighbourhoods (MSOAs) that make up Bedford had a drop in house prices over the same period.
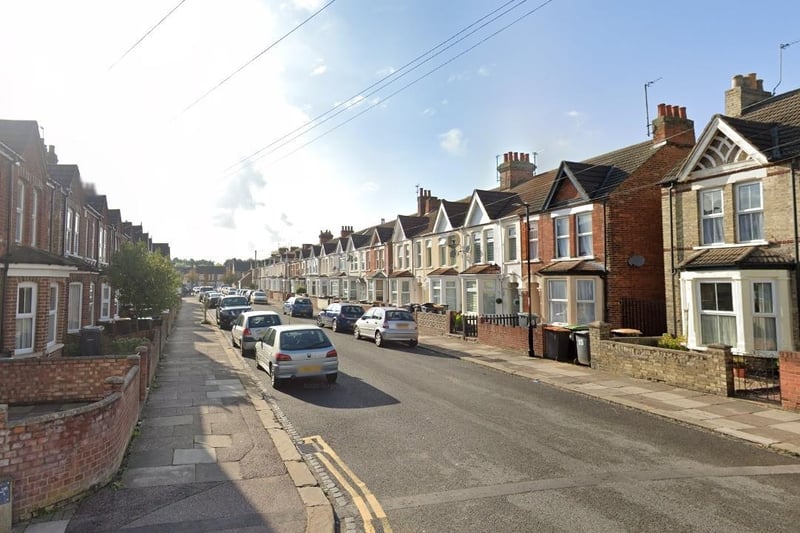
1. Queens Park
The biggest price drop was in Queens Park where the average price fell to £246,229, down by 18.9 per cent on the year to September 2019. Overall, 48 houses changed hands here between October 2019 and September 2020, a drop of 37 per cent. Photo: Google Maps
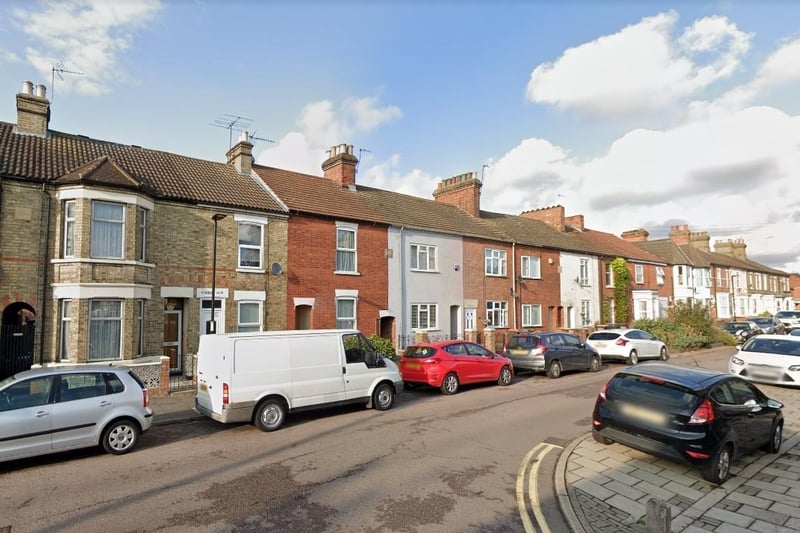
2. Harpur
The second biggest price drop was in Harpur where the average price fell to £206,896, down by eight per cent on the year to September 2019. Overall, 70 houses changed hands here between October 2019 and September 2020, a drop of 44 per cent. Photo: Google Maps
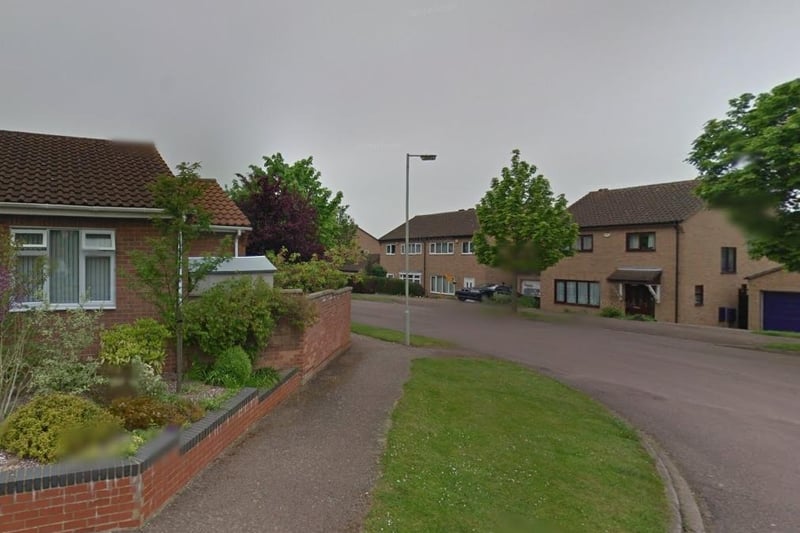
3. Kempston North
The third biggest price drop was in Kempston North where the average price fell to £252,213, down by 7.4 per cent on the year to September 2019. Overall, 40 houses changed hands here between October 2019 and September 2020, a drop of 31 per cent. Photo: Google Maps
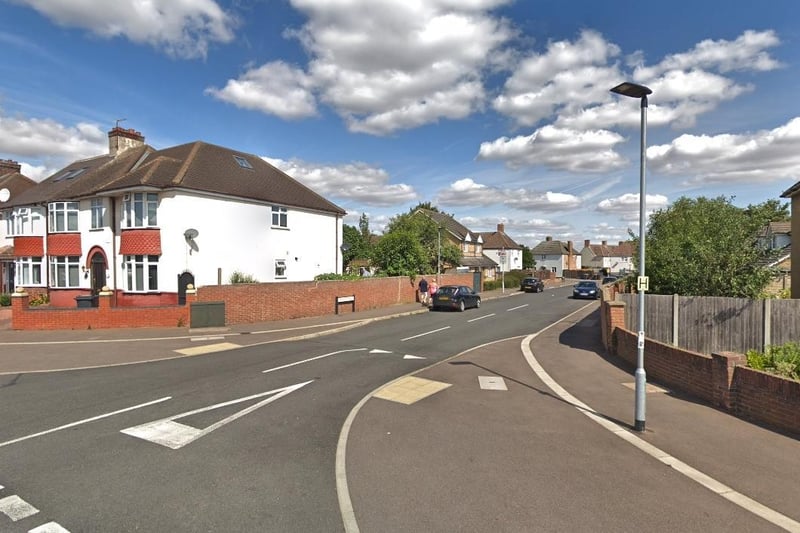
4. Cauldwell
The fourth biggest price drop was in Cauldwell where the average price fell to £204,685, down by 5.2 per cent on the year to September 2019. Overall, 85 houses changed hands here between October 2019 and September 2020, a drop of 24 per cent. Photo: Google Maps