

But despite that, average house prices held up across England – even if there was a drop in sales.
It was the same picture in Central Bedfordshire, where prices rose by 1.2 per cent in the year to September 2020. Across the East of England, prices rose by 2.2 per cent.
The ONS also publishes house price figures by Middle Layer Super Output Areas (MSOAs) – small geographic areas containing an average of 7,200 people.
These show 18 of the 33 MSOAs that make up Central Bedfordshire saw a rise in house prices over the same period.
Here we reveal which neighbourhoods saw the strongest growth in the year to September 2020.
The ONS also publishes house price figures by Middle Layer Super Output Areas (MSOAs) – small geographic areas containing an average of 7,200 people.
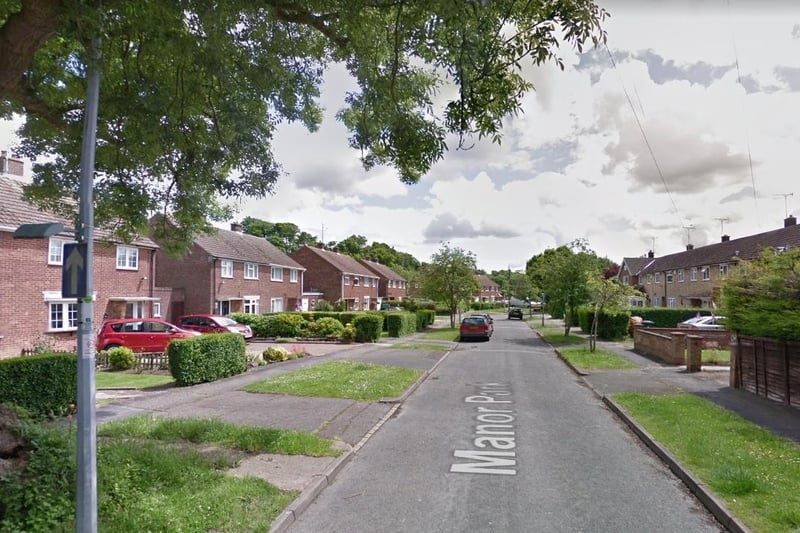
5. Houghton Regis South
The fifth biggest price hike was in Houghton Regis South where the average price rose to £279,963, up by 9.7 per cent on the year to September 2019. Overall, 101 houses changed hands here between October 2019 and September 2020, a drop of 28 per cent. Photo: Google Maps
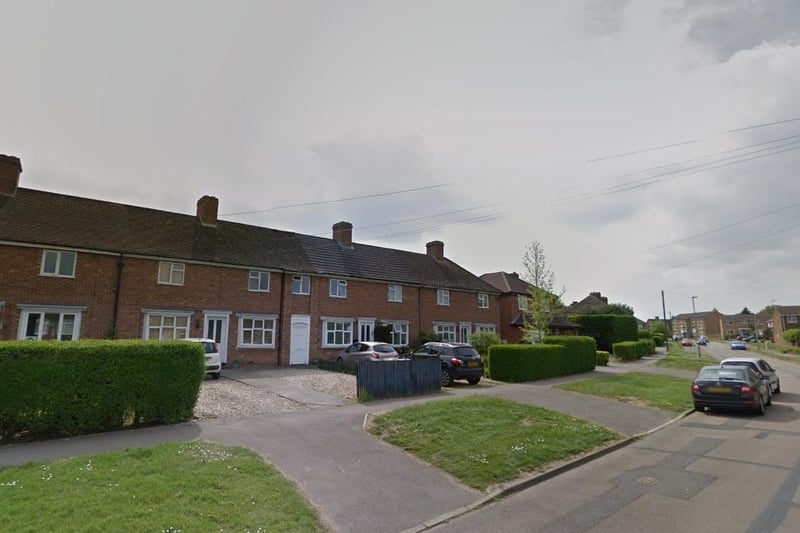
6. Flitwick East
The sixth biggest price hike was in Flitwick East where the average price rose to £354,016, up by 8.6 per cent on the year to September 2019. Overall, 48 houses changed hands here between October 2019 and September 2020, a drop of 38 per cent. Photo: Google Maps
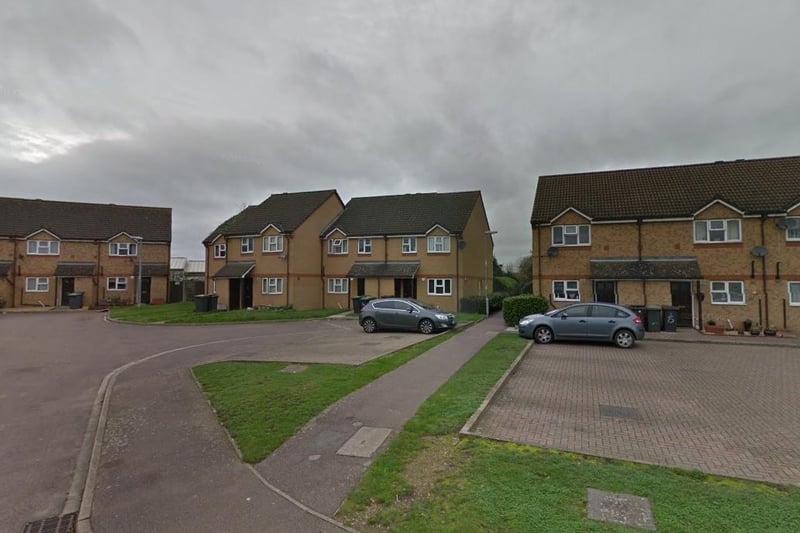
7. Biggleswade West
The seventh biggest price hike was in Biggleswade West where the average price rose to £317,830, up by 5.1 per cent on the year to September 2019. Overall, 209 houses changed hands here between October 2019 and September 2020, a drop of 18 per cent. Photo: Google Maps
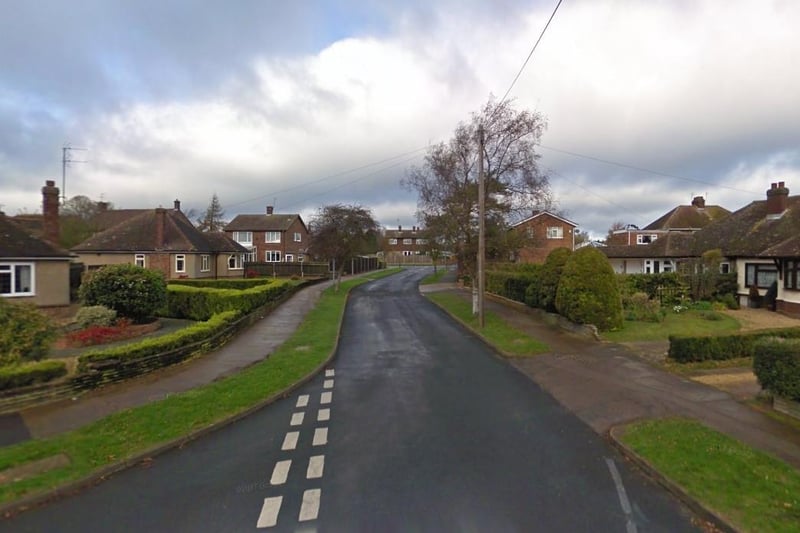
8. Toddington, Heath & Reach
The eighth biggest price hike was in Toddington, Heath & Reach where the average price rose to £387,592, up by five per cent on the year to September 2019. Overall, 205 houses changed hands here between October 2019 and September 2020, a rise of 25 per cent. Photo: Google Maps