
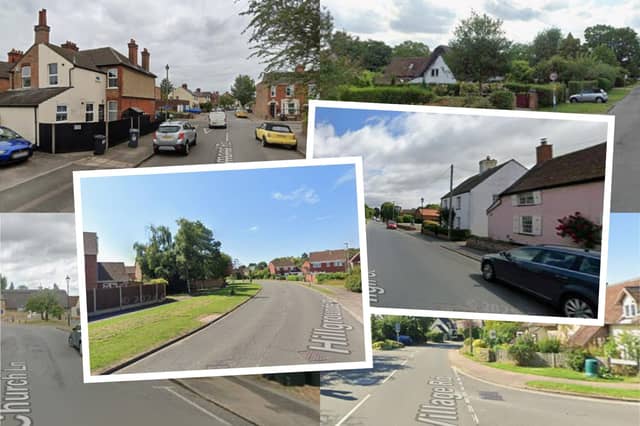

This latest House Growth Report has come from Online Marketing Surgery and property garden furniture company, MG Timber using data from the Office for National Statistics.
It ranks neighbourhoods across Bedford based on their house price percentage change between September 2024 to September 2025.
And some of the figures may shock you – but then again, it could be good news for some house hunters, as areas traditionally out of reach may now be worth a punt.
A spokesperson from Online Marketing Surgery said: “The dip in property prices doesn’t always mean the areas have become less desirable.
“Riseley & Sharnbrook and Bromham & Biddenham still have the highest property values in Bedford, so a percentage decrease there likely reflects the strength of the previous year's figures as much as anything happening now.
“With only four areas seeing prices dip over the year, the overall picture across Bedford is one of growth rather than decline."
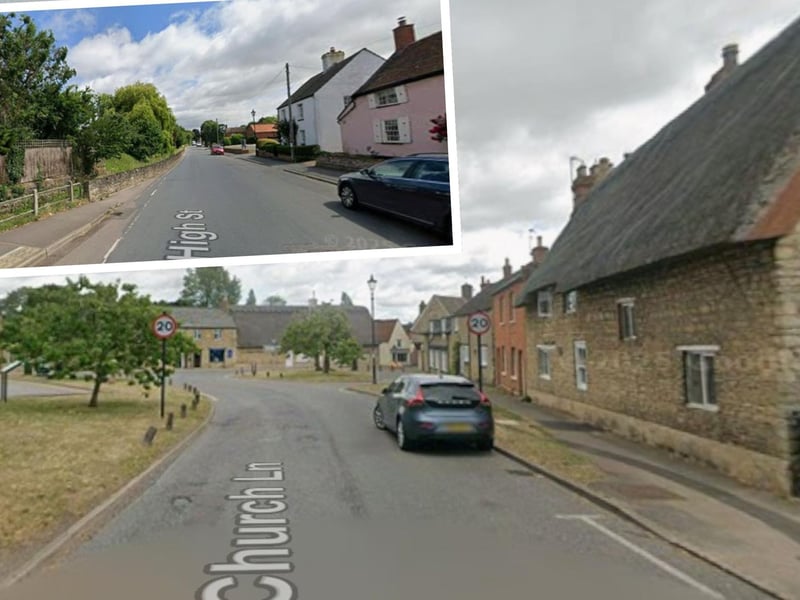
1. Sharnbrook & Riseley
The median property price for Sharnbrook & Riseley (inset) for the year ending September 2024 was £472,500. That dropped by 8.9% for the year ending September 2025 to £430,500 Photo: Google
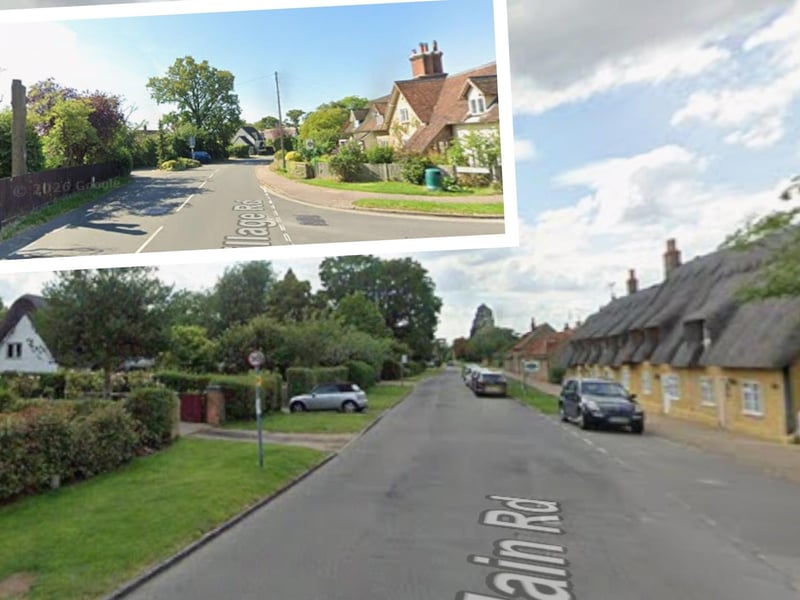
2. Biddenham & Bromham
The median property price for Biddenham & Bromham (inset) for the year ending September 2024 was £435,000. That dropped by 6.3% for the year ending September 2025 to £407,498 Photo: Google
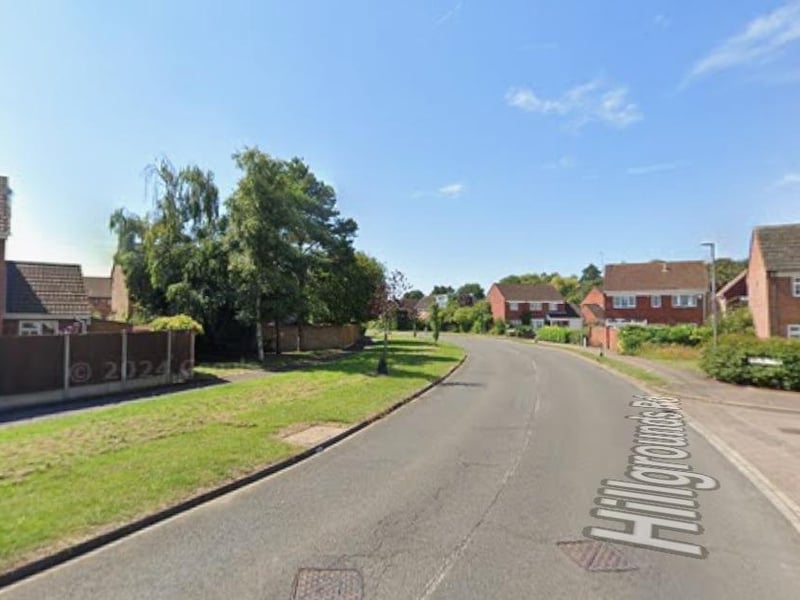
3. Kempston north
The median property price for Kempston north for the year ending September 2024 was £282,500. That dropped by 3.5% for the year ending September 2025 to £272,500 Photo: Google
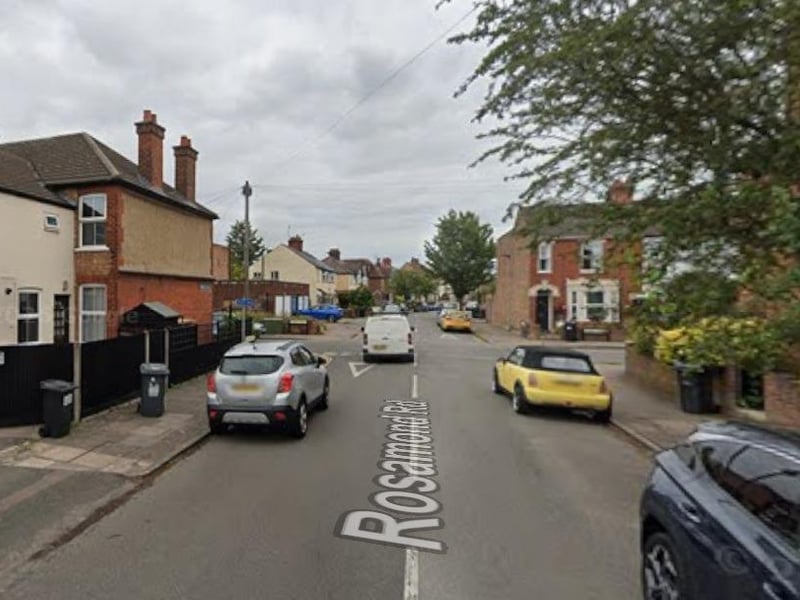
4. Newnham
The median property price for Newnham for the year ending September 2024 was £336,500. That dropped by 1.9% for the year ending September 2025 to £330,000 Photo: Google