

Two neighbourhoods in Bedford are among those in England where people are most likely to struggle to access affordable food, a study suggests.
Millions of households are feeling the pinch at the tills this winter, as the soaring cost of fuel has a knock-on effect on everyday essentials.
In response, researchers from the University of Leeds and the consumer champion Which? have created an index ranking areas on how likely they are to need support to access affordable and healthy food.
In Bedford, just two of the constituency's 68 neighbourhoods were ranked as within the worst 20% for food affordability across England.
The index combined factors such as the number of households on low income, proximity to large supermarkets, the number of children on free school meals, and the availability of online deliveries, to assess which areas were the most in need of access to healthy, reasonably-priced food.
Figures from the Office for National Statistics show the price of food and non-alcoholic drinks rose by 16.2% in the 12 months to October – which it estimates to be the highest rate since 1980.
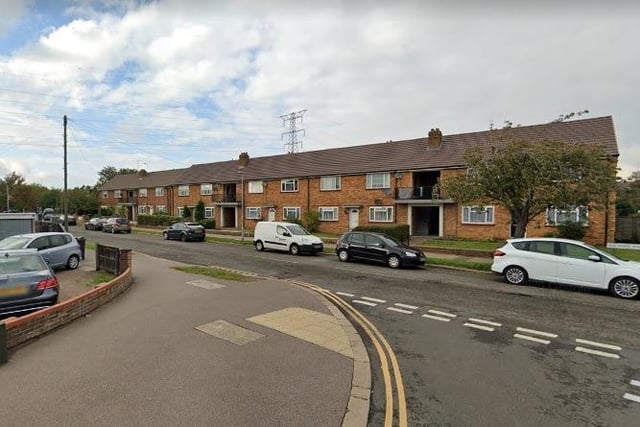
1. Access to Affordable Food
The first area includes Old Ford End Road, Wroxham Way, Martham Close, Ormesby Way, Chester Road, Carlisle Road, Saunders Gardens and Boyde Gradens Photo: Google
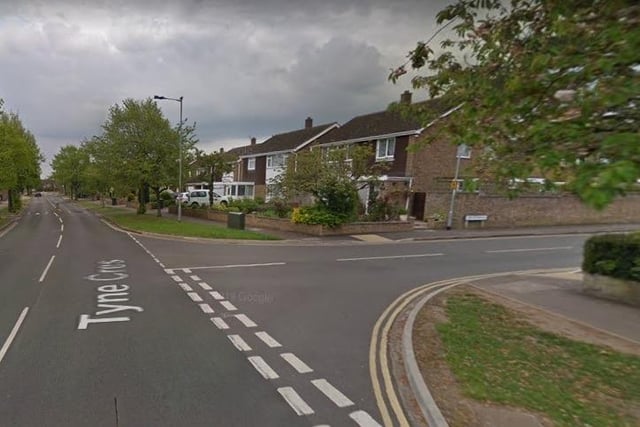
2. Access to Affordable Food
The second area includes Tyne Crescent, Avon Drive, Torridge Rise, Wansbeck Road, Frome Close, Itchen Close, Moriston Road, Rede Close, Ashmead Road, Beaufort Way, Regent Close, Carron Road and The Wear Photo: Google